By Jim Fitch
Machinery Lubrication Magazine
The sheer number of infographics in the condition monitoring field is staggering; they show up on social media, and in conference presentations, whitepapers, websites and books. Infographics are effective at helping people comprehend difficult concepts that integrate an array of variables and factors.
My soon-to-be-published book, “Inspection 2.0,” covers a host of different condition monitoring methods, including sensory inspections. I was looking for an infographic to illustrate failure modes and detection methods in the time domain for different types of machines and applications but was unable to find a graphic that fit my needs.
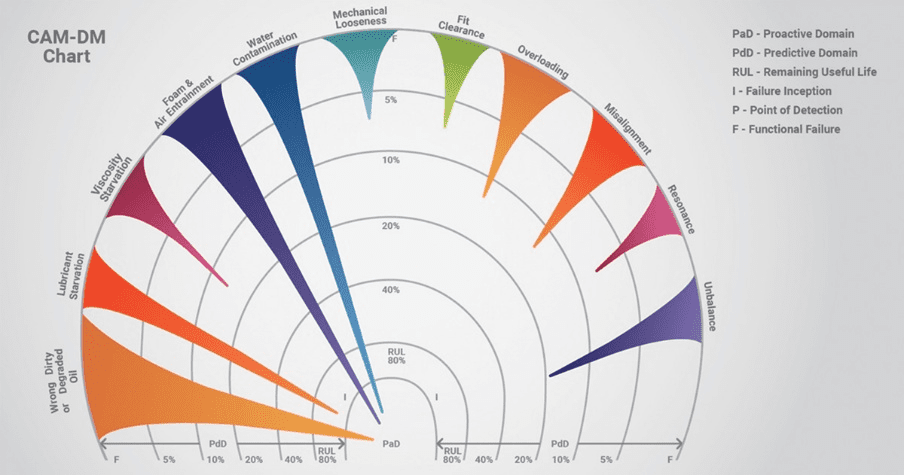
Necessity is the mother of invention. Left without choices, I decided to construct my own graphic, naming it Condition Alarm Mapping (CAM). The final product is shown in the figures on the following pages. However, the number of variations and uses of the CAM graphic is extensive and goes far beyond the scope of this article. As an introduction, I can show and describe what it is, why it is needed, and how it is used.